
IEP Objective Monitoring: 5 Graphing Sheets
On Sale
$1.00
(10% off)
$0.90
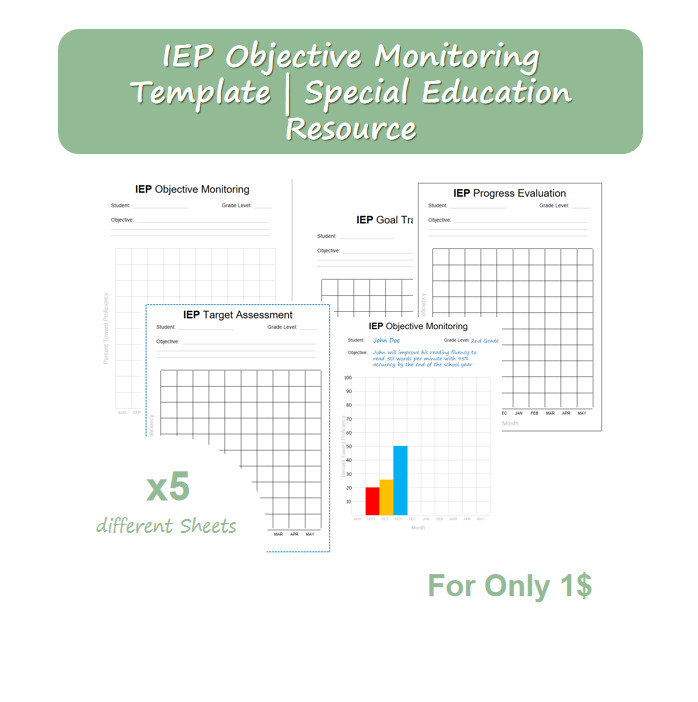
A graph shows progress at a glance in a way rows of numbers do not. These monitoring sheets give you a blank bar-graph grid for tracking percent toward proficiency month by month, so growth or a stall is visible to anyone reviewing the data.
What's Inside
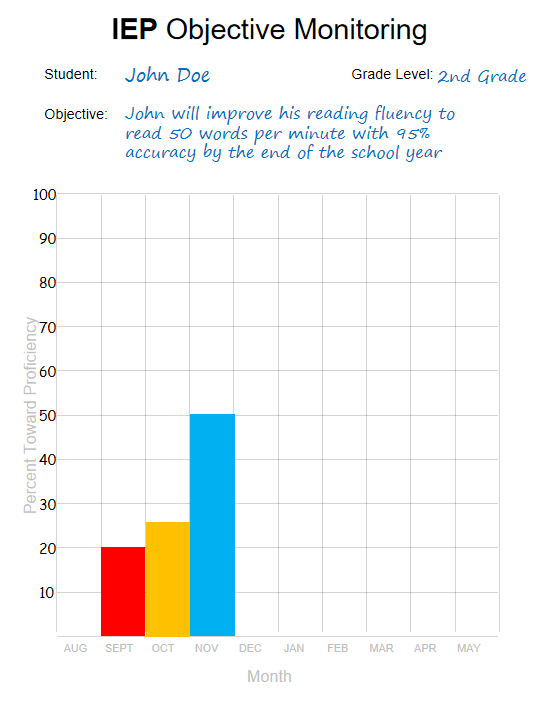
- IEP Objective Monitoring: student, grade and objective header with an August-to-May graphing grid
- IEP Goal Tracking: matching format for a specific goal
- IEP Progress Evaluation: same graphing structure for ongoing evaluation
- IEP Target Assessment: variant for target-based monitoring
- Example: a filled-in reading fluency goal graphed with color-coded monthly bars
- Axes: Percent Toward Proficiency (0-100%) by Month
How It Helps You
- Turns monthly data into a picture families and teams understand quickly
- Keeps every objective in the same, consistent graph format
- Simple to graph by hand with no software
Ways to Use It
Bring the graphs to IEP meetings, share growth with families, or track several objectives across the school year.
Format
PDF (print-ready) and PPTX (editable). 5 sheets. Instant download.
Need more than one?
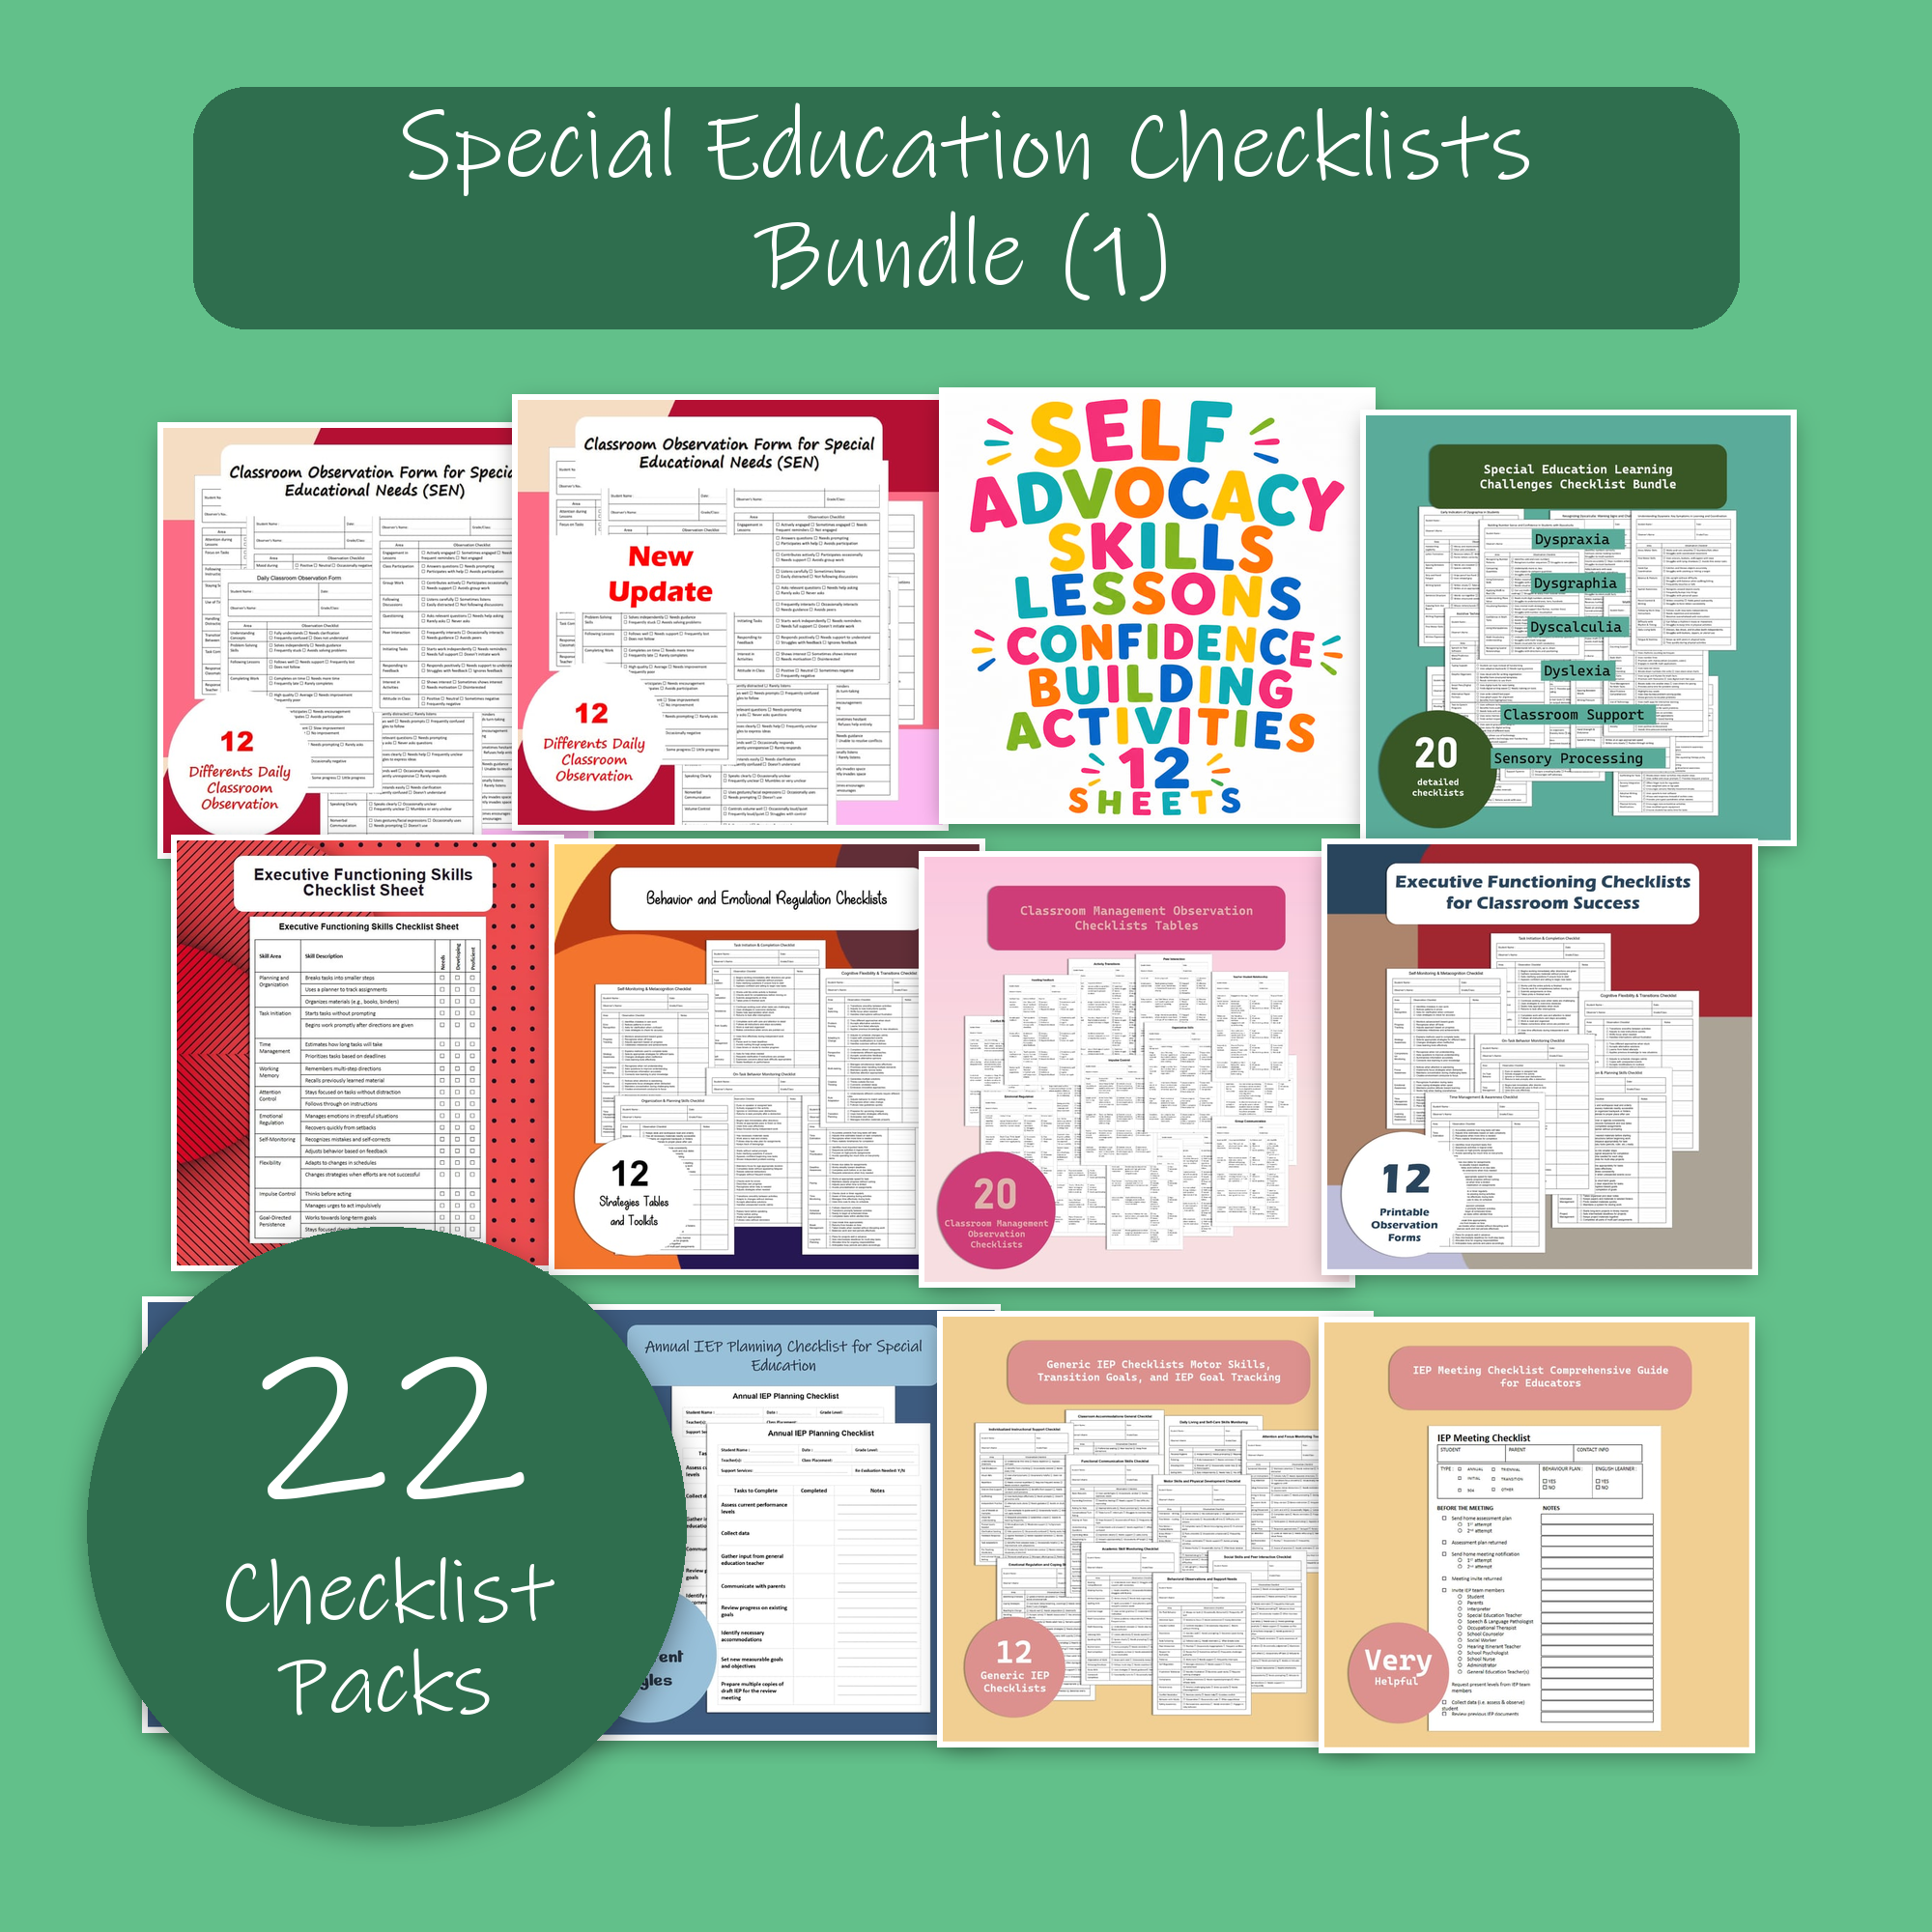
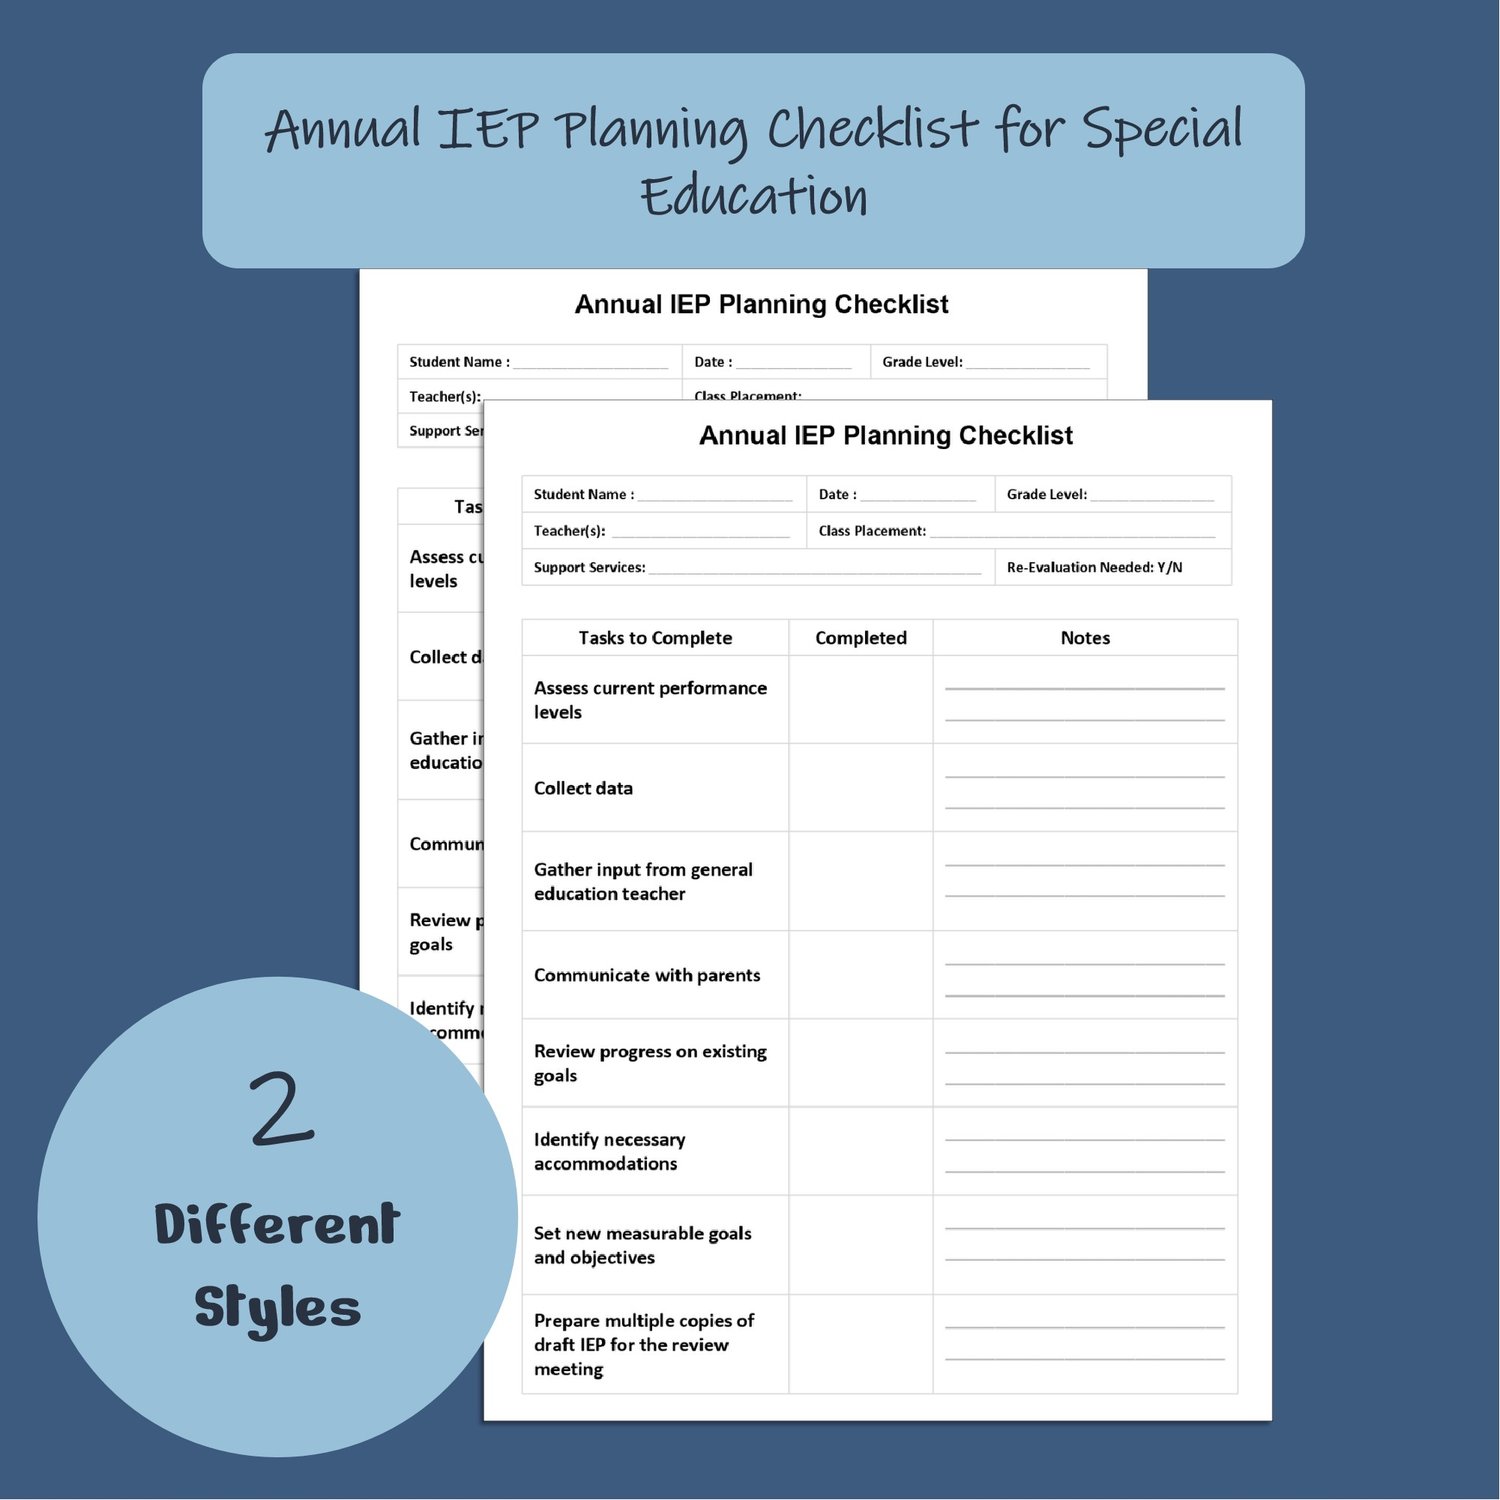
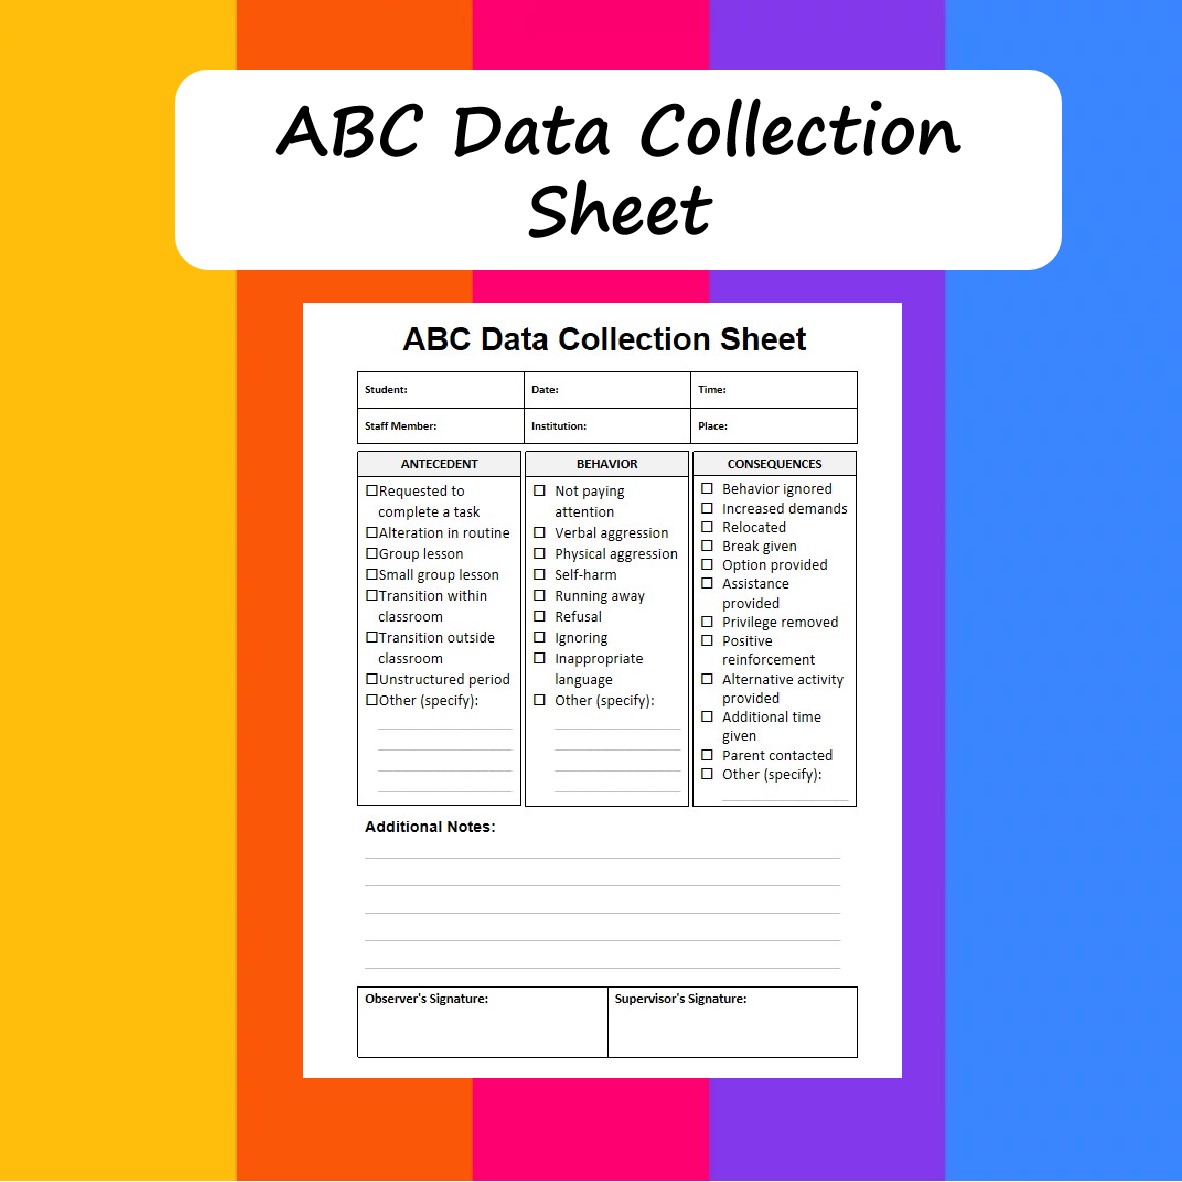
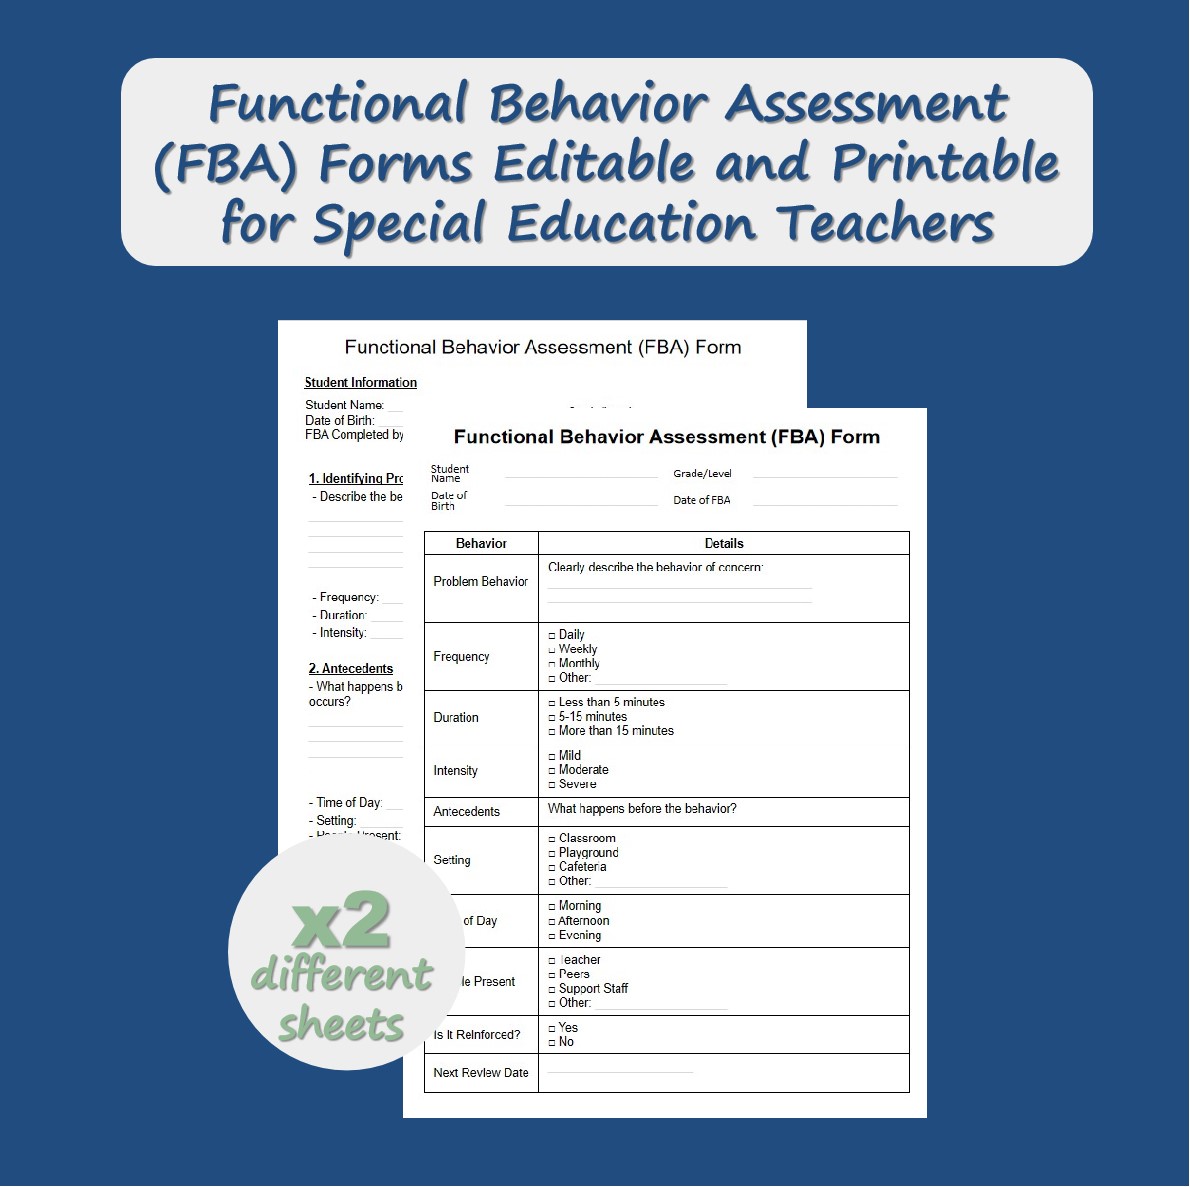
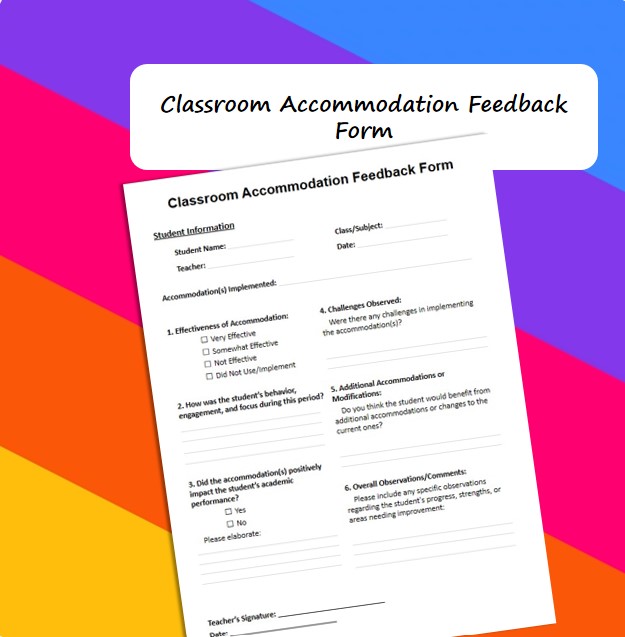
If you graph IEP data, our checklists and data sheets complete the picture. The Special Education Checklists Bundle (1) brings together 22 related resources in one download, and you save 57% compared to buying each item separately.